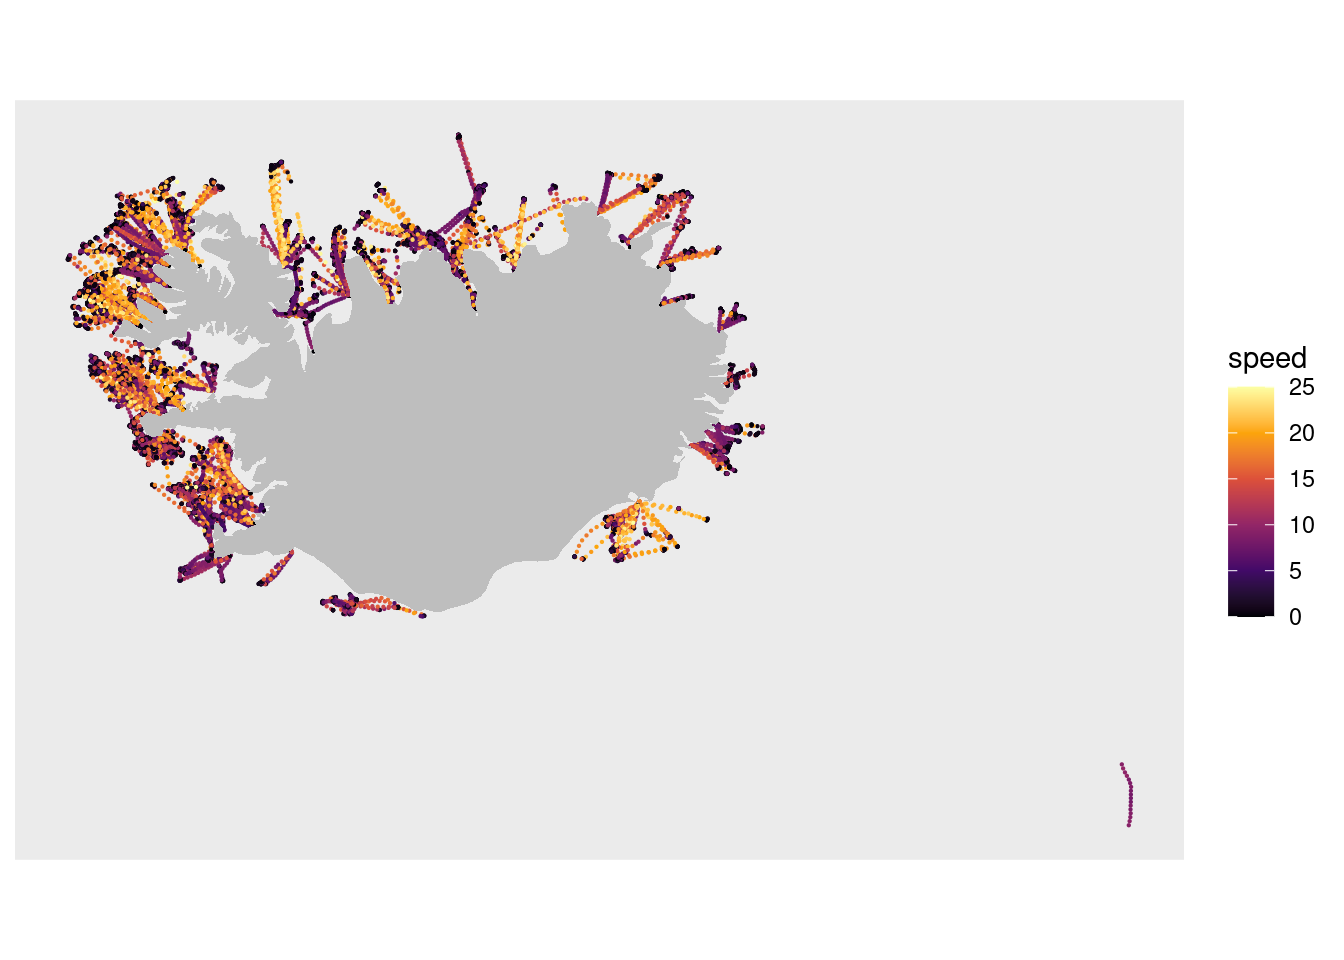
Dagur á sjó

Krókaveiðar standa nú yfir á fullu. Einn af þeim dögum þar sem hvað flestir bátar voru á sjó var 10. júní. Fyrir myndbirtingu á dagsverkinu er fyrst fundnir þeir bátar sem að landað hafa krókafiski á yfirstandandi sumri og sá listi síðan notaður til að finna stk-ferlana á umræddum degi.
code
rtip
Author

Einar Hjörleifsson

Published

July 11, 2025

Code
library(tidyverse)
library(omar)
library(sf)
library(ramb)

harbours <- 
  read_rds("~/cronjobs/skipasjo/harbours.rds") |> 
  select(hid = hid)
island <- 
  read_sf("~/stasi/gis/AIS_TRAIL/data-raw/island.gpkg")
lnd <- 
  nanoparquet::read_parquet("~/stasi/fishydata/data/landings/agf_stations.parquet") |> 
  filter(between(date, ymd("2025-05-05"), ymd("2025-07-30"))) |> 
  filter(gid == 14)
VID <- lnd$vid
mid_vid <- 
  #tbl_mar(con, "ops$einarhj.mobile_vid") |> 
  nanoparquet::read_parquet("~/stasi/fishydata/data/vessels/stk_vessel_match.parquet") |> 
  filter(vid %in% VID) |> 
  select(mid, vid) |> 
  distinct()
MID <- mid_vid$mid
con <- connect_mar()
trail <- 
  stk_trail(con) |>
  filter(rectime >= to_date("2025-06-09", "YYYY:MM:DD"),
         rectime <  to_date("2025-06-11", "YYYY:MM:DD")) |> 
  collect(n = Inf) |> 
  filter(mid %in% MID)
# trail$mid |> unique() |> length()
trail <- 
  trail |> 
  left_join(mid_vid) |> 
  select(vid, time, lon, lat, speed, heading) |> 
  group_by(vid) |> 
  distinct(time, .keep_all = TRUE) %>%
  ungroup() |> 
  filter(between(lon, -35, 30),
         between(lat, 50, 79)) %>%
  st_as_sf(coords = c("lon", "lat"),
           crs = 4326,
           remove = FALSE) |> 
  st_join(harbours) |> 
  st_join(island) |> 
  mutate(on_land = case_when(!is.na(hid)  & on_land == TRUE ~ FALSE,
                             is.na(hid)   & on_land == TRUE ~ TRUE,
                             .default = FALSE)) |> 
  filter(!on_land) |> 
  mutate(speed = ifelse(speed > 25, 25, speed)) |> 
  group_by(vid) %>%
  arrange(time) %>%
  mutate(max.time = max(time, na.rm = TRUE),
         min.time = min(time, na.rm = TRUE),
         max.time.in.harbour = max(time[!is.na(hid)])) %>%
  ungroup() %>%
  mutate(days = as.integer(difftime(today(), lubridate::as_date(time), units = "days"))) %>%
  group_by(vid) %>%
  # cruise id (aka tripid), negative values: in harbour
  mutate(.cid = ramb::rb_trip(!is.na(hid))) %>%
  ungroup() |> 
  arrange(vid, time)
trail <- 
  trail |> 
  filter(between(time, ymd_hms("2025-06-10 00:00:00"), ymd_hms("2025-06-11 00:00:00")))
trail |> 
  filter(.cid > 0,
         lon > -29) |> 
  ggplot() +
  #theme_void() +
  geom_point(aes(lon, lat, colour = speed),
             size = 0.1) +
  geom_polygon(data = geo::island, aes(lon, lat), fill = "grey") +
  coord_quickmap() +
  scale_colour_viridis_c(option = "inferno") +
  scale_x_continuous(NULL, NULL) +
  scale_y_continuous(NULL, NULL)

Code
rb_mapdeck <- function (d, col = "speed", tooltip = "speed", no_lines = TRUE, 
                        radius = 400, highlight_colour = "black", stroke_colour = "pink") {
  col2hex <- function(cname) {
    colMat <- col2rgb(cname)
    grDevices::rgb(red = colMat[1, ]/255, green = colMat[2, 
    ]/255, blue = colMat[3, ]/255)
  }
  if (!"sf" %in% class(d)) {
    d <- sf::st_as_sf(d, coords = c("lon", "lat"), crs = 4326)
  }
  if (!no_lines) {
    track <- sf::st_cast(dplyr::summarise(d, do_union = FALSE), 
                         "LINESTRING")
  }
  m <- 
    mapdeck::mapdeck(style = mapdeck::mapdeck_style("streets"))
  if (!no_lines) {
    m <- mapdeck::add_path(m, data = track, layer_id = "track", 
                           stroke_width = 300, width_min_pixels = 1, width_max_pixels = 5, 
                           auto_highlight = TRUE, highlight_colour = paste0(col2hex(highlight_colour), 
                                                                            "80"), 
                           update_view = FALSE, 
                           stroke_colour = paste0(col2hex(stroke_colour), 
                                                  "80"))
  }
  mapdeck::add_scatterplot(m, data = d, fill_colour = col, 
                           radius = radius, tooltip = tooltip, layer_id = "points", 
                           palette = "rdylgn", legend = TRUE) |> 
    mapdeck::mapdeck_view(location = c(-22, 66), zoom = 7)
}

m <- 
  trail |> 
  filter(.cid > 0) |> 
  arrange(vid, time) |> 
  group_by(vid, .cid) |> 
  rb_mapdeck(no_lines = FALSE, radius = 600)
m