library(raster)
library(leaflet)
library(sf)
library(viridis)
library(tidyverse)
library(arrow)
# remotes::install_github("einarhjorleifsson/omar")
library(omar)
con <- connect_mar()Preamble
The objective is to get an overview of the spatial effort of the lumpsucker fisheries using AIS-data (STK) and compare them with the regulatory areas where lumpsucker fisheries has been banned since 2020.
Normally one would filter the AIS signal based on recordings in the logbbooks. Captains reporting has however been notoriously poor in the past although in recent years there have been significant improvements. So the approach taken here is:
- Use the lumpsucker licence database to filter out AIS data for a specific period given the start and end time of the licence.
- Filter AIS data further limiting ping values to date of reported landings as reported in the landings database
This approach has certain limitation:
- The lumpsucker fisheries is a classical gilnet fisheries is a classical gillnet fisheries were the setting may take place numerous days prior to retrieval. Hence the AIS signal are only attempting to cover the retrieval process.
- The date reported in the landings database may potentially lag behind the actual retrieval date.
# background shapes
area_closure <-
gisland::read_lmi("fiskistofa:virk_grasleppulokanir") |>
st_make_valid() |>
select(heiti) |>
mutate(heiti = c("4.I", "4.II", "4.III", "4.IV", "4.V",
"4.VI", "4.VII", "4.VIII", "4.IX", "4.X",
"4.XI", "4.XII", "4.XIII", "4.XIV")) |>
mutate(area_m2 = st_area(geom),
.after = heiti) #|>
#mutate(heiti = as.factor(heiti))
latur_landselir <-
"/u3/haf/gisland/data/adhoc/ni_d25v_landselir_1980_2018_selalatur_fl.gpkg" |>
read_sf() |>
select(nafn = nafnFitju:ar2018, area = Shape_Area) |>
st_cast("MULTIPOLYGON") |>
st_transform(crs = 4326)
latur_landselir_2sjm <-
latur_landselir |>
st_transform(crs = 3857) |>
st_buffer(dist = 1852 * 2, nQuadSegs = 100) |>
st_transform(crs = 4326) |>
st_cast("MULTILINESTRING")
latur_utselir <-
"/u3/haf/gisland/data/adhoc/ni_d25v_utselir_1982_2017_selalatur_fl.gpkg" |>
read_sf() |>
select(nafn = nafnFitju:ar2017, area = Shape_Area) |>
st_cast("MULTIPOLYGON") |>
st_transform(crs = 4326)
latur_utselir_2sjm <-
latur_utselir |>
st_transform(crs = 3857) |>
st_buffer(dist = 1852 * 2, nQuadSegs = 100) |>
st_transform(crs = 4326) |>
st_cast("MULTILINESTRING")
fuglar <-
"/u3/haf/gisland/data/adhoc/ni_f25v_mikilvaegFuglasvaedi_fl.gpkg" |>
read_sf() |>
st_cast("MULTIPOLYGON") |>
st_make_valid() |>
select(nafn = nafnFitju,
flokkur = flokkurSva,
area = Shape_Area) |>
st_transform(crs = 4326) |>
drop_na() |>
filter(flokkur %in% c("FG", "SF"))# Licences overview ------------------------------------------------------------
lic <-
read_csv(here::here("ramb/2025-01-15_hrognkelsi/licence_dates.csv")) |>
rename(.rid = 1,
vid = skip.nr,
d1 = start,
d2 = finish) |>
mutate(d1 = dmy(d1),
d2 = dmy(d2),
.rid = as.integer(.rid),
vid = as.integer(vid),
licence = as.integer(licence))
p <-
lic |>
mutate(vid = factor(vid)) |>
ggplot() +
geom_segment(aes(x = d1, xend = d2, y = reorder(vid, d1), yend = reorder(vid, d1),
colour = area)) +
scale_colour_brewer(palette = "Set1") +
labs(x = "Date") +
scale_y_discrete("Vessel")
# used for initial filtering of landings data
VIDs <-
lic |>
pull(vid) |>
unique()
# Landings ---------------------------------------------------------------------
landings_date_lumpsucker <-
nanoparquet::read_parquet(here::here("data/landings/agf_stations.parquet")) |>
filter(vid %in% VIDs,
gid %in% c(3, 4)) |>
collect() |>
mutate(date = as_date(date)) |>
select(vid, date) |>
distinct()
# AIS data ---------------------------------------------------------------------
lic <-
lic |>
select(vid, d1, d2, area) |>
arrow::as_arrow_table() |>
to_duckdb()
ais <-
open_dataset("~/stasi/fishydata/data/ais/trail") |>
select(vid, date, time, lon, lat, speed) |>
to_duckdb() |>
inner_join(lic,
by = join_by(vid, between(date, d1, d2))) |>
collect() |>
# only dates when landings reported
inner_join(landings_date_lumpsucker,
by = join_by(vid, date))
p <-
ais |>
mutate(speed = ifelse(speed > 15, 15, speed)) |>
mutate(speed = round(speed, 1)) |>
count(speed) |>
ggplot(aes(speed, n / 1e3)) +
geom_col() +
scale_x_continuous(breaks = seq(0, 15, by = 2)) +
labs(x = "Speed [kn]",
y = "Number of pings [thousands]",
caption = "Lumpsucker speed profile on landing date")
pal <- unikn::pal_unikn_pair
names(pal) <- NULL
effort_by_area <-
ais |>
# Speed cut-off for hauling
filter(between(speed, 0.1, 2)) |>
st_as_sf(coords = c("lon", "lat"),
crs = 4326) |>
st_join(area_closure |> mutate(heiti = as.factor(heiti))) |>
st_drop_geometry() |>
mutate(year = year(time)) |>
group_by(year, heiti) |>
reframe(pings = n())
effort_by_area |>
mutate(heiti = fct_expand(heiti, "utan")) |>
mutate(heiti = replace_na(heiti, "utan")) |>
ggplot(aes(year, pings, fill = heiti)) +
geom_col(position = "fill") +
labs(x = NULL, y = "Relative effort",
caption = "Lumpsucker effort outside and inside area closures") +
scale_x_continuous(breaks = seq(2008, 2024, by = 2)) +
scale_y_continuous(breaks = seq(0, 1, by = 0.1)) +
#scale_fill_manual(values = pal) +
geom_vline(xintercept = 2019.5)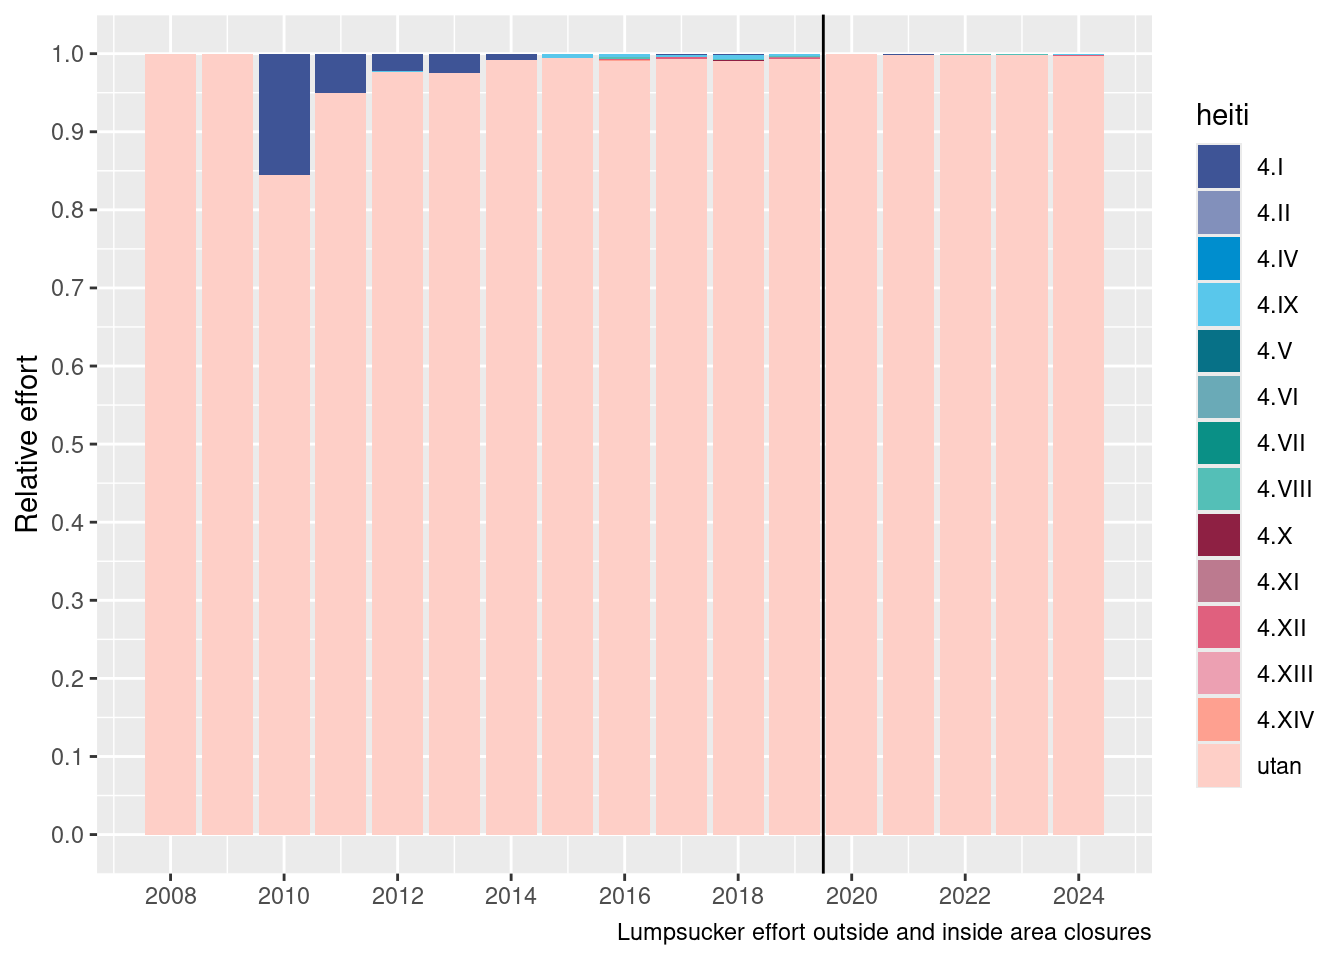
… hmmmmmm, basically when the area closure was set in place there had effectively been very limited lumpsucker fishieres in the areas closed.
grade <- function(x, dx = 0.01) {
x %/% dx * dx + dx/2
}
grid <-
ais |>
filter(between(speed, 0.1, 2)) |>
filter(between(lon, -30, -10),
between(lat, 63, 68)) |>
mutate(lon = grade(lon, 0.005),
lat = grade(lat, 0.005/2),
year = year(time)) |>
filter(year >= 2015) |>
group_by(lon, lat) |>
reframe(pings = n(),
n.years = n_distinct(year))
r <-
grid |>
mutate(pings = ifelse(pings > quantile(pings, 0.95), quantile(pings, 0.95), pings)) |>
# only grid cells if reported in more than one year
filter(n.years > 1) |>
select(lon, lat, pings) |>
raster::rasterFromXYZ()
raster::crs(r) <- "epsg:4326"
inf <- inferno(12, alpha = 1, begin = 0, end = 1, direction = -1)
pal <- colorNumeric(inf, raster::values(r), na.color = "transparent")
#r |> raster::writeRaster("hrognkelsanet.tif")
# ordinary gillnet fishery -----------------------------------------------------
ais <-
open_dataset("~/stasi/fishydata/data/ais/trail") |>
select(vid, date, time, lon, lat, speed) |>
to_duckdb()
lan <-
nanoparquet::read_parquet(here::here("data/landings/agf_stations.parquet")) |>
filter(gid == 2) |>
collect() |>
mutate(date = as_date(date)) |>
as_arrow_table() |>
to_duckdb()
grid2 <-
ais |>
filter(year(date) >= 2015) |>
inner_join(lan,
by = join_by(date, vid)) |>
collect() |>
filter(between(speed, 0.1, 2)) |>
filter(between(lon, -30, -10),
between(lat, 63, 68)) |>
mutate(lon = grade(lon, 0.005),
lat = grade(lat, 0.005/2),
year = year(time)) |>
group_by(lon, lat) |>
reframe(pings = n(),
n.years = n_distinct(year))
r2 <-
grid2 |>
mutate(pings = ifelse(pings > quantile(pings, 0.95), quantile(pings, 0.95), pings)) |>
# only grid cells if reported in more than one year
filter(n.years > 1) |>
select(lon, lat, pings) |>
raster::rasterFromXYZ()
raster::crs(r2) <- "epsg:4326"
inf <- inferno(12, alpha = 1, begin = 0, end = 1, direction = -1)
pal2 <- colorNumeric(inf, raster::values(r2), na.color = "transparent")
#r2 |> raster::writeRaster("þorskfiskanet.tif")
l <-
leaflet(options = leafletOptions(minZoom = 4, maxZoom = 12)) %>%
addTiles(urlTemplate = "https://server.arcgisonline.com/ArcGIS/rest/services/World_Imagery/MapServer/tile/{z}/{y}/{x}",
group = "Image",
attribution = 'Data source: <a href="https://www.hafogvatn.is">Marine Rearch Institute</a>') %>%
setView(-18, 65.2, zoom = 6) %>%
addRasterImage(r, colors = pal, opacity = 1, group = "Grásleppuveiðar",
maxBytes = Inf,
project = TRUE) |>
addRasterImage(r2, colors = pal2, opacity = 1, group = "Þorsknetaveiðar",
maxBytes = Inf,
project = TRUE) |>
addPolygons(data = area_closure, color = "white", weight = 1, opacity = 1, fillColor = 0, group = "Svæðalokanir") |>
addPolygons(data = latur_landselir, weight = 1, fillColor = "cyan", fillOpacity = 1, group = "Landsselslátur") |>
addPolylines(data = latur_landselir_2sjm, weight = 2, color = "cyan", opacity = 1, group = "Landsselslátur 2 sjómílur") |>
addPolygons(data = latur_utselir, weight = 1, fillColor = "red", fillOpacity = 1, group = "Útselslátur") |>
addPolylines(data = latur_utselir_2sjm, weight = 2, color = "red", opacity = 1, group = "Útselslátur 2 sjómílur") |>
addPolylines(data = fuglar |> filter(flokkur == "SF"),
weight = 2,
color = "pink", opacity = 1, group = "Sjófuglar") |>
addPolylines(data = fuglar |> filter(flokkur == "FG"),
weight = 2,
color = "orange", opacity = 1, group = "Fjörufuglar") |>
addLayersControl(
overlayGroups = c("Grásleppuveiðar", "Þorsknetaveiðar", "Svæðalokanir",
"Landsselslátur", "Landsselslátur 2 sjómílur",
"Útselslátur", "Útselslátur 2 sjómílur",
"Sjófuglar", "Fjörufuglar"),
options = layersControlOptions(collapsed = FALSE)) |>
hideGroup(group = c("Landsselslátur", "Landsselslátur 2 sjómílur",
"Útselslátur", "Útselslátur 2 sjómílur",
"Sjófuglar", "Fjörufuglar", "Þorsknetaveiðar"))
l