Longline: Percent of total grid area per number of distinct vessels
n_vid
250
500
1000
2000
3000
4000
5000
1
80.7
70.3
57.6
44.1
37.1
33.1
30.3
2
14.8
20.1
24.1
25.0
24.0
22.7
21.7
3
3.2
6.1
10.3
14.1
15.4
15.5
15.5
4
0.9
2.1
4.3
7.9
9.6
10.6
10.8
5
0.3
0.8
1.9
4.1
5.9
6.9
7.5
6
0.1
0.3
0.9
2.1
3.4
4.4
5.1
7
0.0
0.2
0.4
1.1
1.8
2.6
3.4
8
0.0
0.1
0.2
0.7
1.0
1.5
1.9
9
0.0
0.0
0.1
0.4
0.7
1.0
1.2
10
0.0
0.0
0.1
0.2
0.4
0.6
0.9
11
NA
0.0
0.0
0.1
0.3
0.4
0.6
12
NA
0.0
0.0
0.1
0.2
0.3
0.3
13
NA
0.0
0.0
0.1
0.1
0.2
0.3
14
NA
NA
0.0
0.0
0.1
0.1
0.2
15
NA
NA
0.0
0.0
0.0
0.1
0.1
16
NA
NA
NA
0.0
0.0
0.1
0.1
17
NA
NA
NA
0.0
0.0
0.0
0.1
18
NA
NA
NA
NA
0.0
0.0
0.0
19
NA
NA
NA
0.0
0.0
0.0
0.0
20
NA
NA
NA
NA
0.0
0.0
0.0
21
NA
NA
NA
NA
NA
0.0
0.0
Code
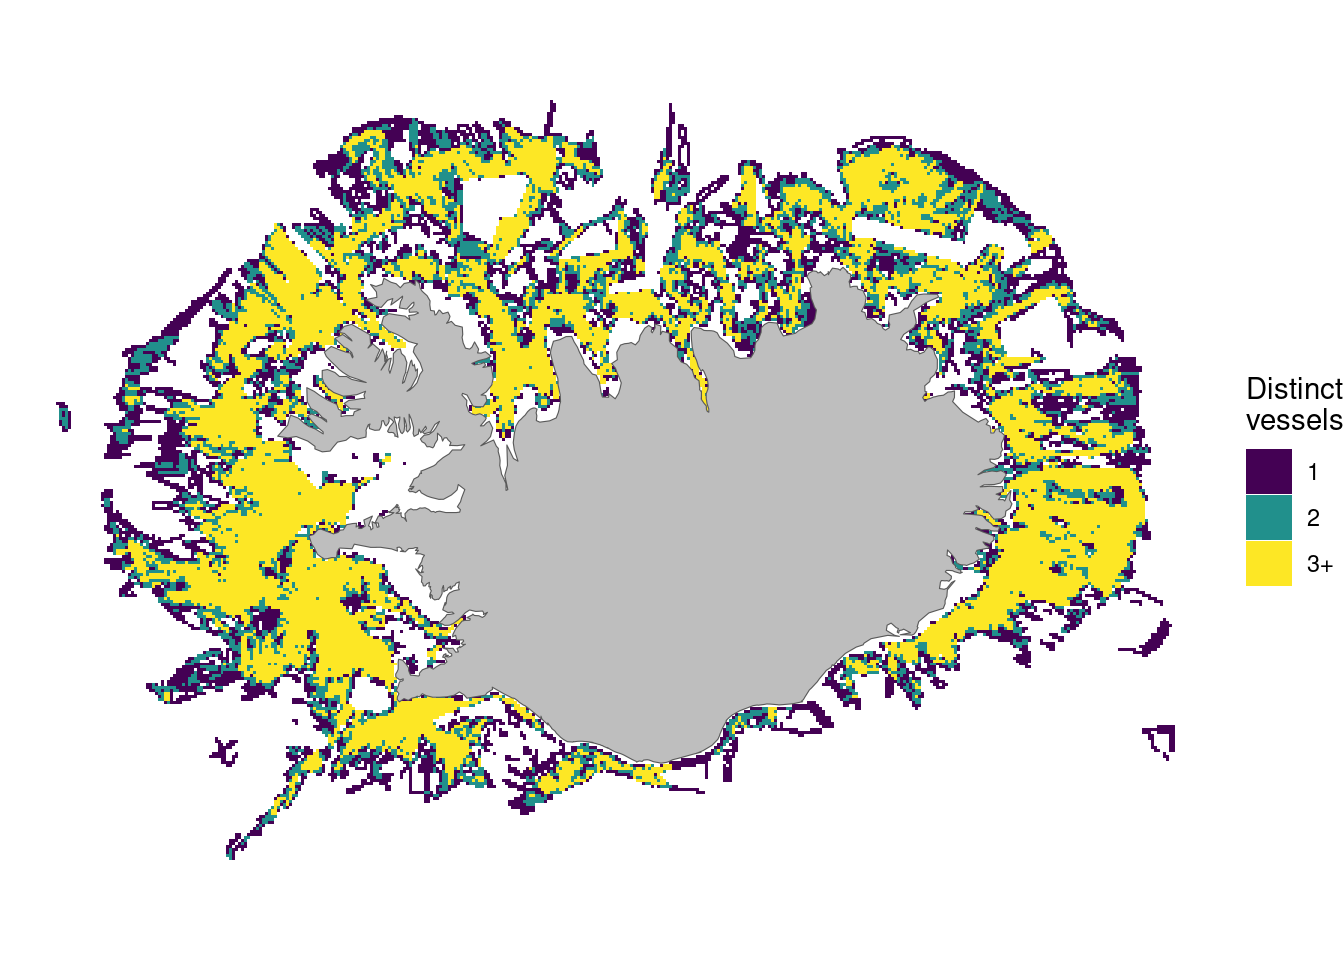
d |>filter(grid ==5000) |>mutate(n_vid =case_when(n_vid >=3~"3+",.default =as.character(n_vid))) |>ggplot() +theme_void() +geom_tile(aes(x, y, fill = n_vid)) +geom_sf(data = island, fill ="grey") +scale_fill_viridis_d(direction =1) +coord_sf() +labs(fill ="Distinct\nvessels")
Longline: 5000 x 5000 meter grid
Code
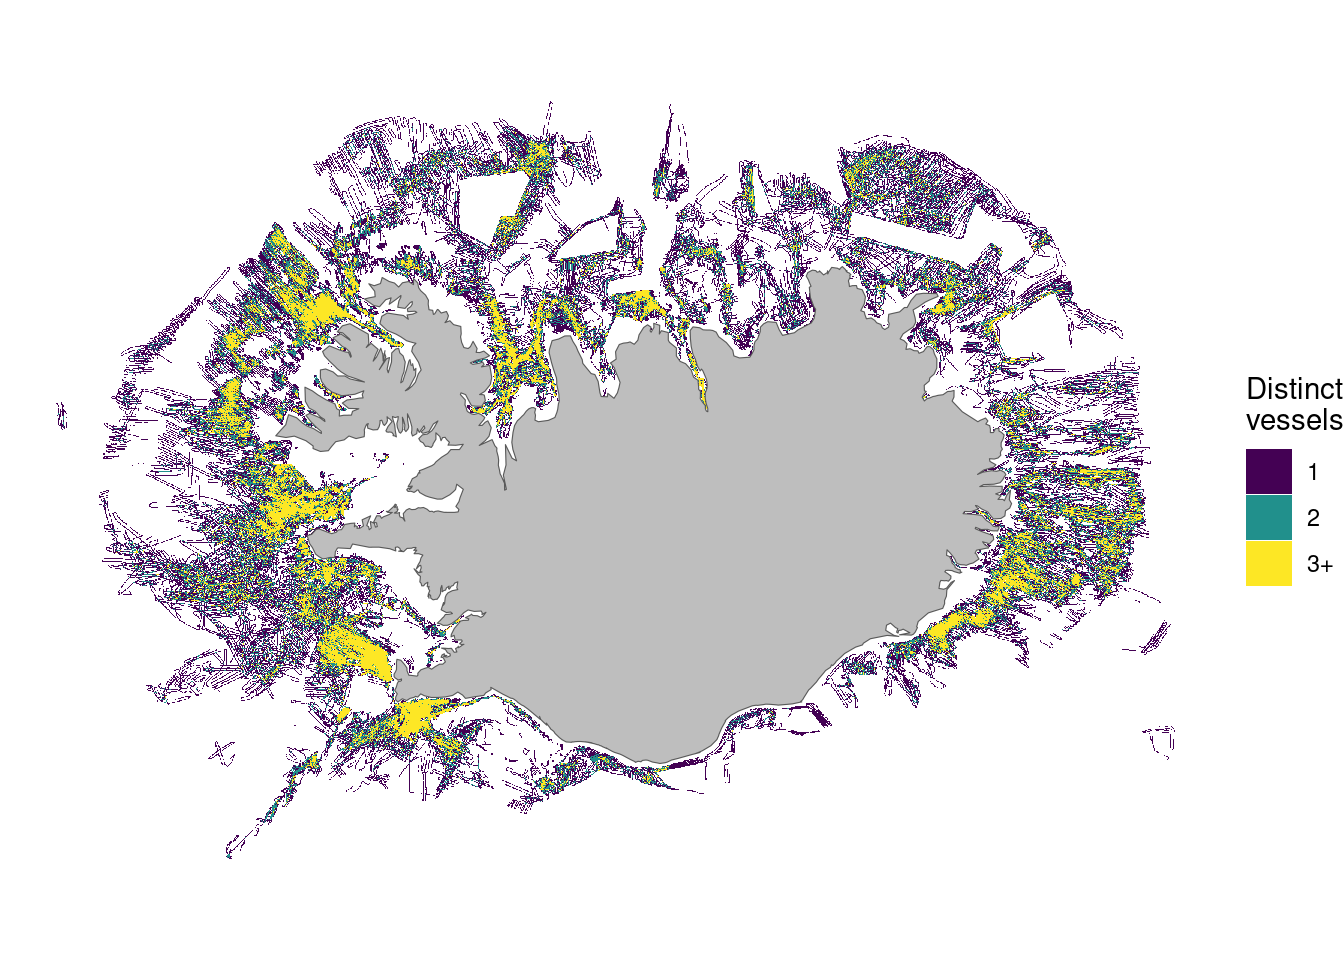
d |>filter(grid ==1000) |>mutate(n_vid =case_when(n_vid >=3~"3+",.default =as.character(n_vid))) |>ggplot() +theme_void() +geom_tile(aes(x, y, fill = n_vid)) +geom_sf(data = island, fill ="grey") +scale_fill_viridis_d(direction =1) +coord_sf() +labs(fill ="Distinct\nvessels")
Bottom trawl: Percent of total grid area per number of distinct vessels
n_vid
250
500
1000
2000
3000
4000
5000
1
54.8
43.6
34.8
29.1
26.5
25.1
23.9
2
21.7
21.6
18.9
16.1
15.0
14.4
14.0
3
10.0
12.4
12.8
11.2
10.2
9.6
9.0
4
5.0
7.4
9.0
8.8
8.2
7.7
7.4
5
2.8
4.4
6.4
7.2
7.1
6.6
6.4
6
1.7
2.8
4.5
5.7
5.9
5.8
5.7
7
1.1
1.9
3.2
4.4
4.7
5.0
5.3
8
0.7
1.3
2.2
3.5
3.9
4.2
4.1
9
0.5
0.9
1.5
2.7
3.3
3.4
3.4
10
0.4
0.7
1.1
2.1
2.6
3.0
3.2
11
0.3
0.5
0.9
1.5
2.1
2.4
2.6
12
0.2
0.4
0.7
1.2
1.6
1.9
2.2
13
0.2
0.3
0.6
0.8
1.3
1.6
1.7
14
0.1
0.3
0.5
0.8
1.0
1.4
1.5
15
0.1
0.2
0.4
0.7
0.9
1.1
1.4
16
0.1
0.2
0.3
0.5
0.7
1.0
1.1
17
0.1
0.2
0.2
0.4
0.5
0.7
0.8
18
0.1
0.1
0.2
0.4
0.5
0.6
0.8
19
0.1
0.1
0.2
0.3
0.4
0.6
0.7
20
0.1
0.1
0.2
0.3
0.4
0.4
0.6
21
0.0
0.1
0.2
0.2
0.3
0.4
0.5
22
0.0
0.1
0.2
0.2
0.3
0.4
0.4
23
0.0
0.1
0.1
0.2
0.2
0.3
0.3
24
0.0
0.1
0.1
0.2
0.2
0.3
0.4
25
0.0
0.1
0.1
0.2
0.2
0.2
0.3
26
0.0
0.0
0.1
0.1
0.1
0.2
0.3
27
0.0
0.0
0.1
0.1
0.2
0.2
0.2
28
0.0
0.0
0.1
0.1
0.2
0.2
0.2
29
0.0
0.0
0.1
0.1
0.1
0.2
0.1
30
0.0
0.0
0.1
0.1
0.1
0.1
0.2
31
0.0
0.0
0.1
0.1
0.1
0.1
0.1
32
0.0
0.0
0.0
0.1
0.1
0.1
0.2
33
0.0
0.0
0.0
0.1
0.1
0.1
0.1
34
NA
0.0
0.0
0.1
0.1
0.1
0.1
35
NA
0.0
0.0
0.1
0.1
0.1
0.1
36
NA
0.0
0.0
0.1
0.1
0.1
0.1
37
NA
0.0
0.0
0.1
0.1
0.1
0.1
38
NA
NA
0.0
0.1
0.1
0.1
0.1
39
NA
NA
0.0
0.0
0.1
0.1
0.1
40
NA
NA
0.0
0.0
0.1
0.1
0.1
41
NA
NA
NA
0.0
0.0
0.1
0.1
42
NA
NA
NA
0.0
0.0
0.0
0.1
43
NA
NA
NA
NA
0.0
0.0
0.0
44
NA
NA
NA
NA
NA
0.0
0.0
Code
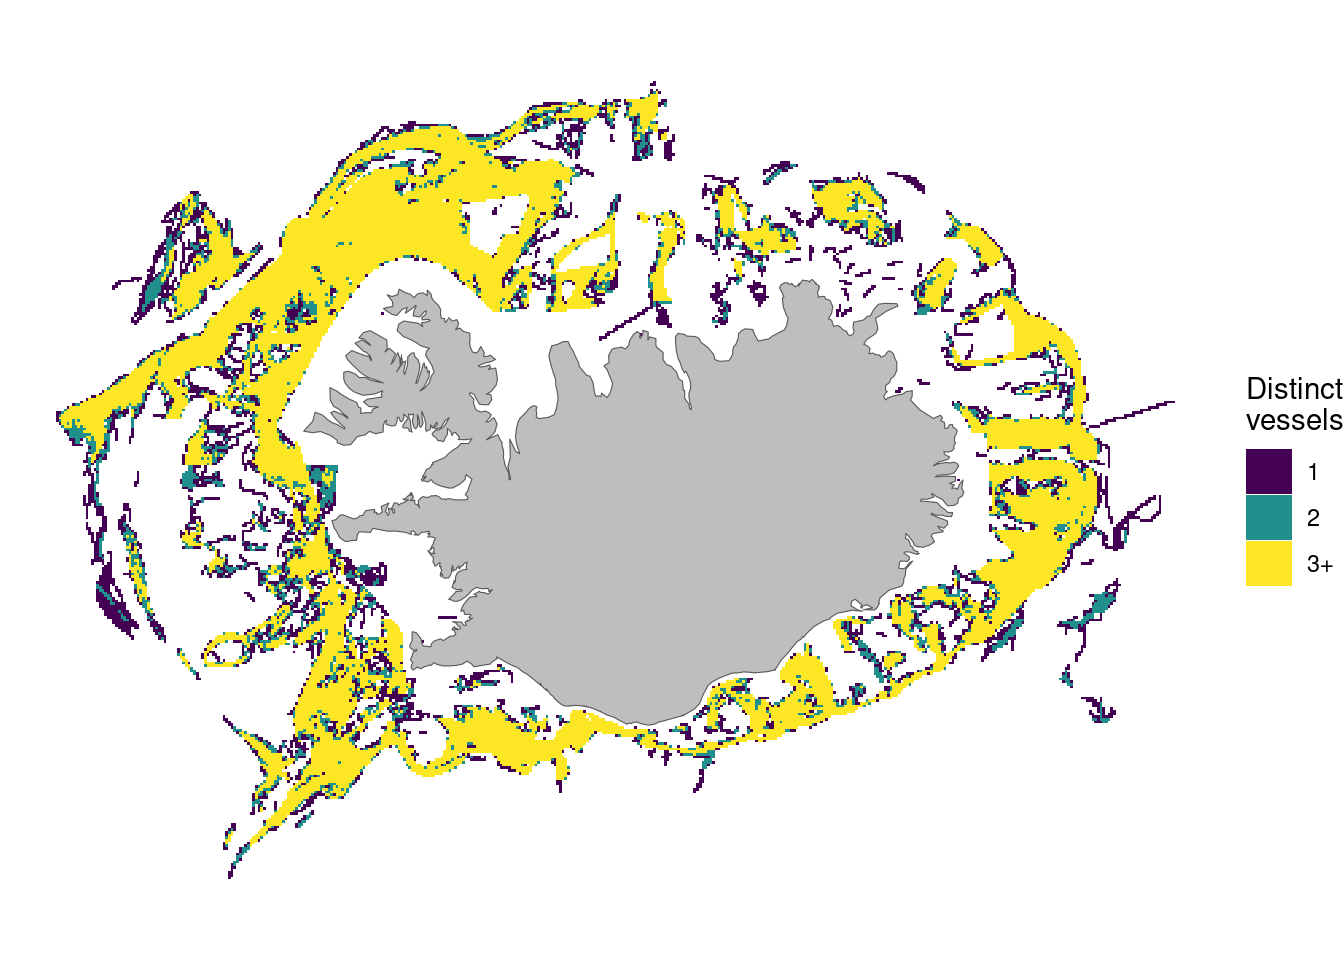
d |>filter(grid ==5000) |>mutate(n_vid =case_when(n_vid >=3~"3+",.default =as.character(n_vid))) |>ggplot() +theme_void() +geom_tile(aes(x, y, fill = n_vid)) +geom_sf(data = island, fill ="grey") +scale_fill_viridis_d(direction =1) +coord_sf() +labs(fill ="Distinct\nvessels")
Bottom fish trawl: 5000 x 5000 meter grid
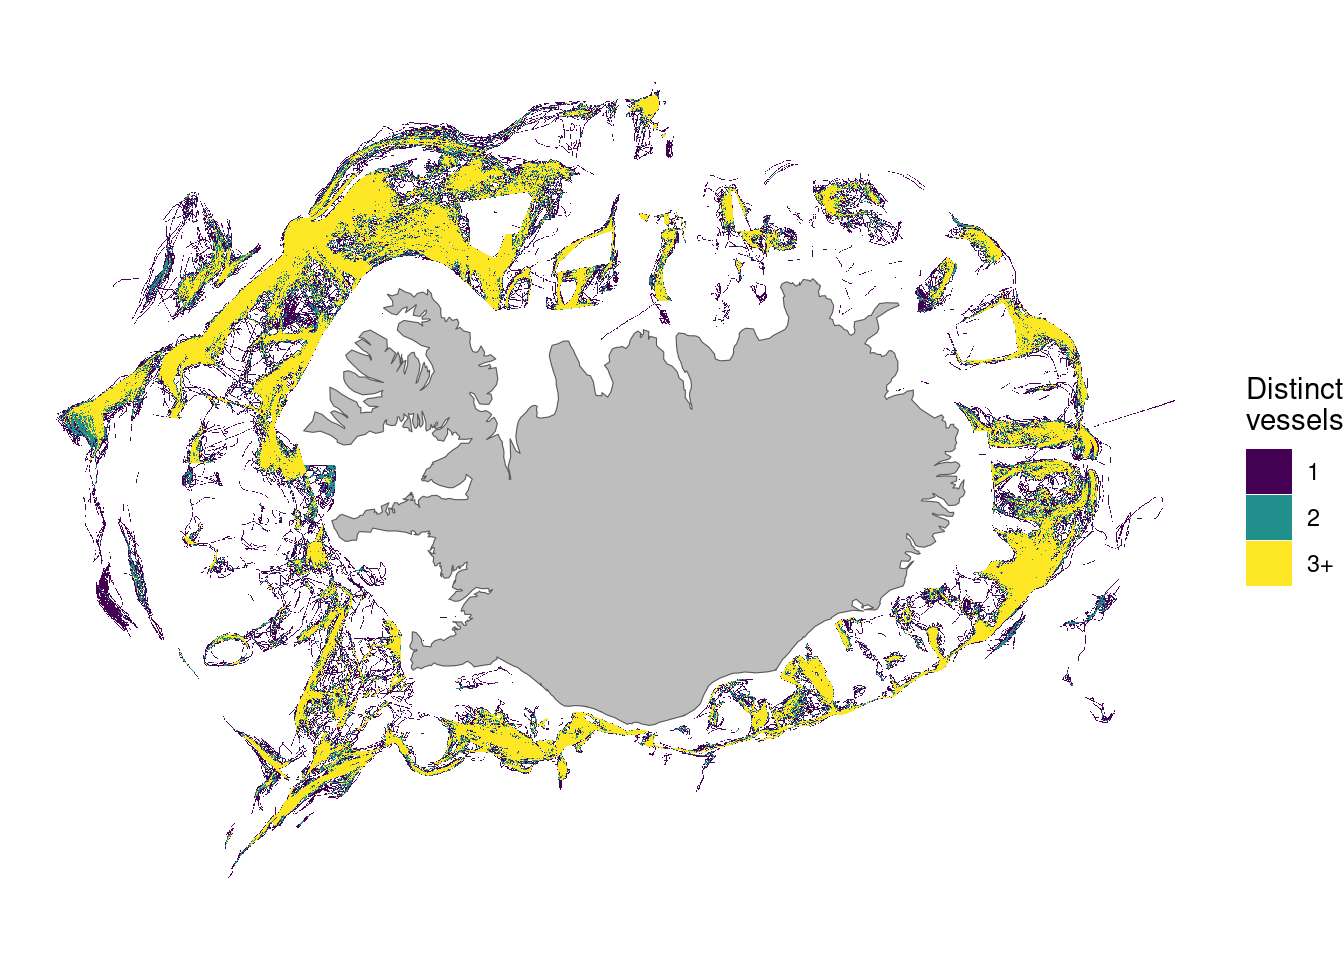
Code
d |>filter(grid ==1000) |>mutate(n_vid =case_when(n_vid >=3~"3+",.default =as.character(n_vid))) |>ggplot() +theme_void() +geom_tile(aes(x, y, fill = n_vid)) +geom_sf(data = island, fill ="grey") +scale_fill_viridis_d(direction =1) +coord_sf() +labs(fill ="Distinct\nvessels")