Reproduction
For many species, the feeding and spawning areas are separate and thus the fish must migrate between these areas. The spawning areas may be close to land and as the fish become more aggregated in these areas, they are more vulnerable to fishers. The movement between the feeding and spawning areas is dictated by the spawning cycle thus a better understanding of this aspect of their life history can give lead to a better understanding of the distribution of the population. This knowledge is essential when estimating abundance from survey data; survey coverage may not cover adults and juveniles distribution equally.
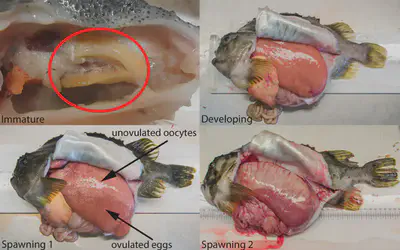
The fishing season for female lumpfish begins in March and goes on until August. As this is a roe fishery, the question arose, are fish spawning throughout this entire period or is their a specific time within this period when most of the fish spawn. In order to start to figure this out, the first thing we had to do was develop a maturity scale which would allow us to distinguish fish which were still developing their gonads, are close to spawning and when spawning was imminent. So we started collecting ovary samples from several scientific surveys which occurred during the year, and also from the fishery. It became apparent that we could differentiate fish which were developing their ovary and those which were about to spawn just from their appearance (Figure 1).
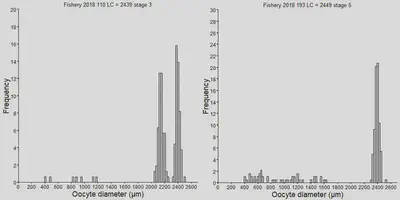
In order to assess fish how long fish at the developing stage would take to spawn, we measured the oocytes (immature egg cells) within the ovary. We did this by taking a photo of the oocytes laid out under a microscope, and then using the image analysis tools ImageJ together with ObjectJ, we could automatically get a measurement of the eggs. This provided an oocyte distribution and the larger the oocytes, the closer they were to spawning. From the oocyte size distribution, we could also see that lumpfish produce two batches of eggs per year (Fig 2a) and we could identify fish which had already spawned their first batch and were getting ready to spawn their second (Fig 2b).
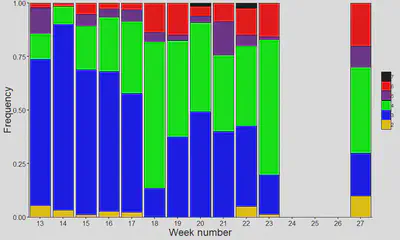
Now that we can identify fish which about to spawn based upon ovulated oocytes in their ovary, or have already spawned one batch and preparing to spawn another, we can take fish which were caught in the fishery and see if they are about to spawn. When doing this we see that there are fish spawning from March until August (Figure 3).
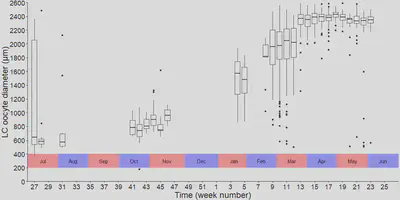
From the data we have collected from the different surveys through the year, we can see that the development of ovaries for lumpfish takes a minimum of 8 months and is likely to be longer (Figure 4). Ovary development has already begun in June and continues through the year until the spawning season in March. This data also shows that the fishery is selecting for fish which are very close to spawning. Fish which are not ready to spawn are found in deeper water far from land.